Trial Outline Builder Screenshots
A research project I am working on has resulted in the Trial Outline Builder, or TOB. This is a support tool for clinical trials. It helps people design trials, it helps with data collection when running trials, and it helps you explore the data collected during trials.
The system was built using "Webbles", a form of pluggable software objects. This made it easy to prototype new functionality in the system.
Here are some screenshots of what the system looks like (click on the images to make them bigger):
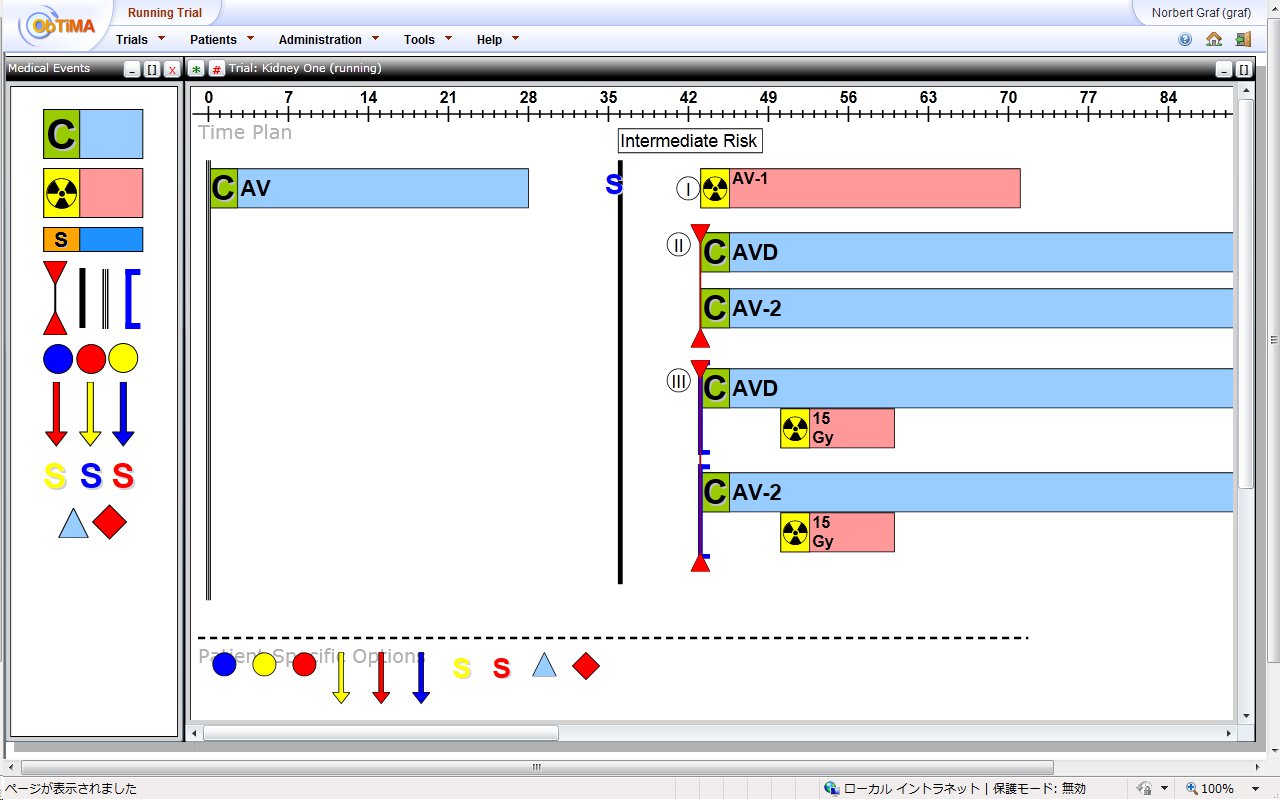
This is the mode for designing trials. On the left
there is a repository of medical events applicable to a
trial (on cancer in this case), such as radio therapy
events, surgery events etc. You can drag and drop events
from the repository into the flow chart on the right. There
you can drag around events, change their properties, etc.,
through direct manipulation.
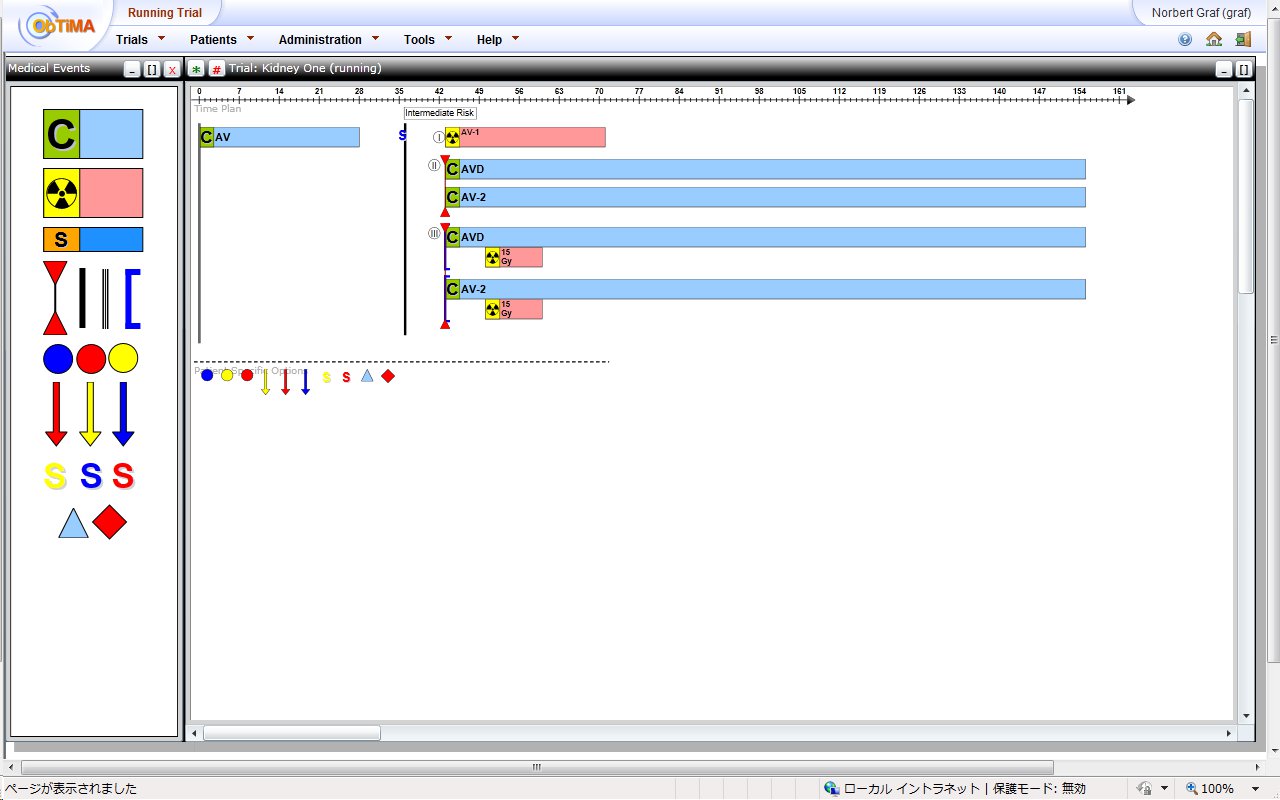
You can zoom the view to see
the whole trial at once, or to look at smaller details
more closely.
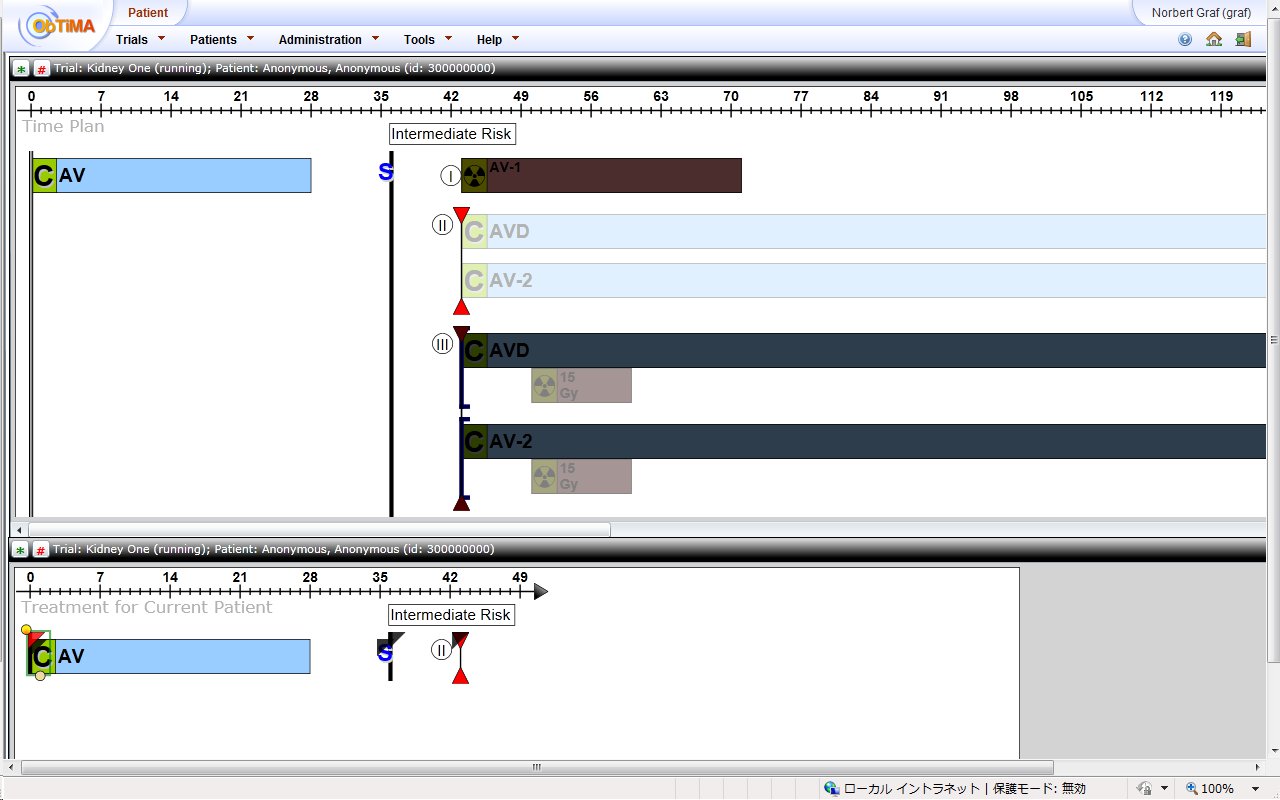
When a trial has been
designed and is running, the TOB can also be used for
data collection. On the top we have the overview of
the flow of the whole trial, and below we have the
individual treatment plan of one specific patient in
the trial. The blacked out parts in the trial plan are
parts of the trial that this patient will not go into
(because the patient is in a different track), and the
whiteish parts are parts of the trial that the patient
has not entered yet (are still in the future).
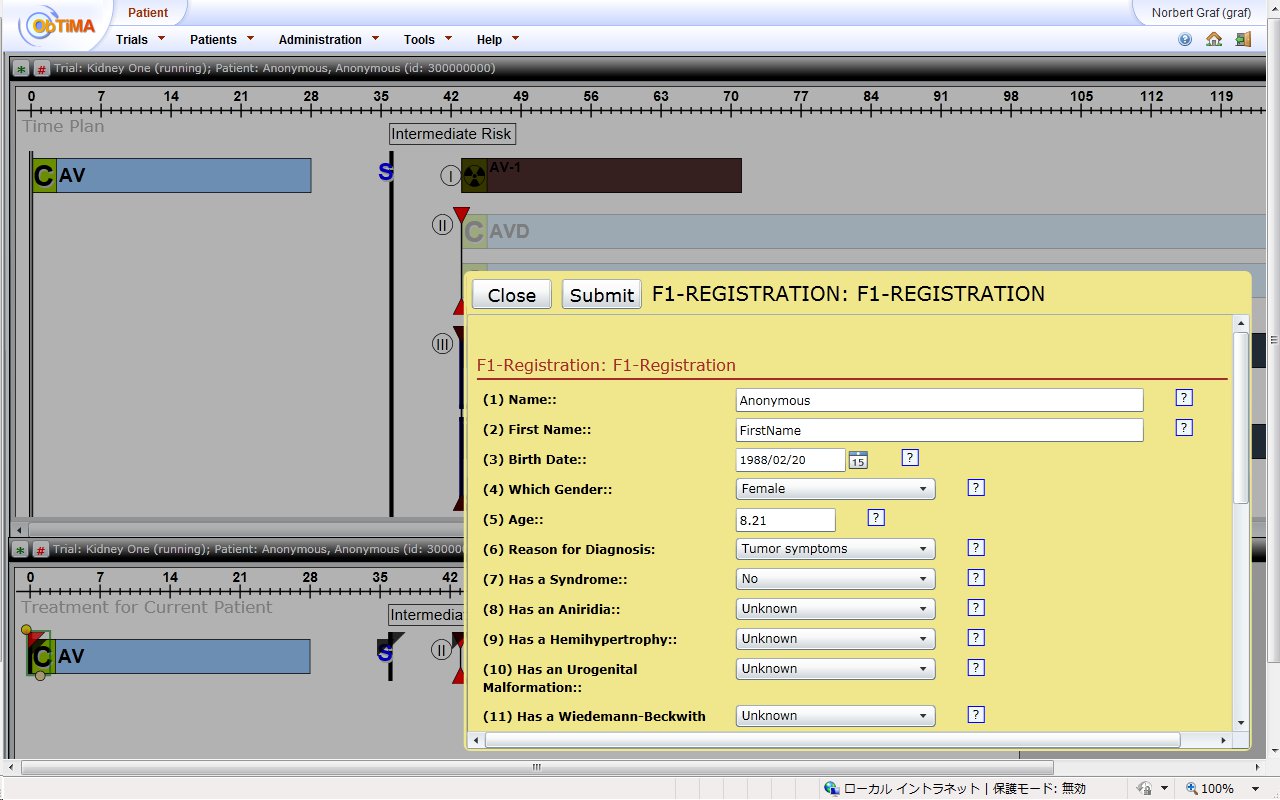
Clicking on an event brings up the data input form
associated with this event for easy data input into
the correct forms.
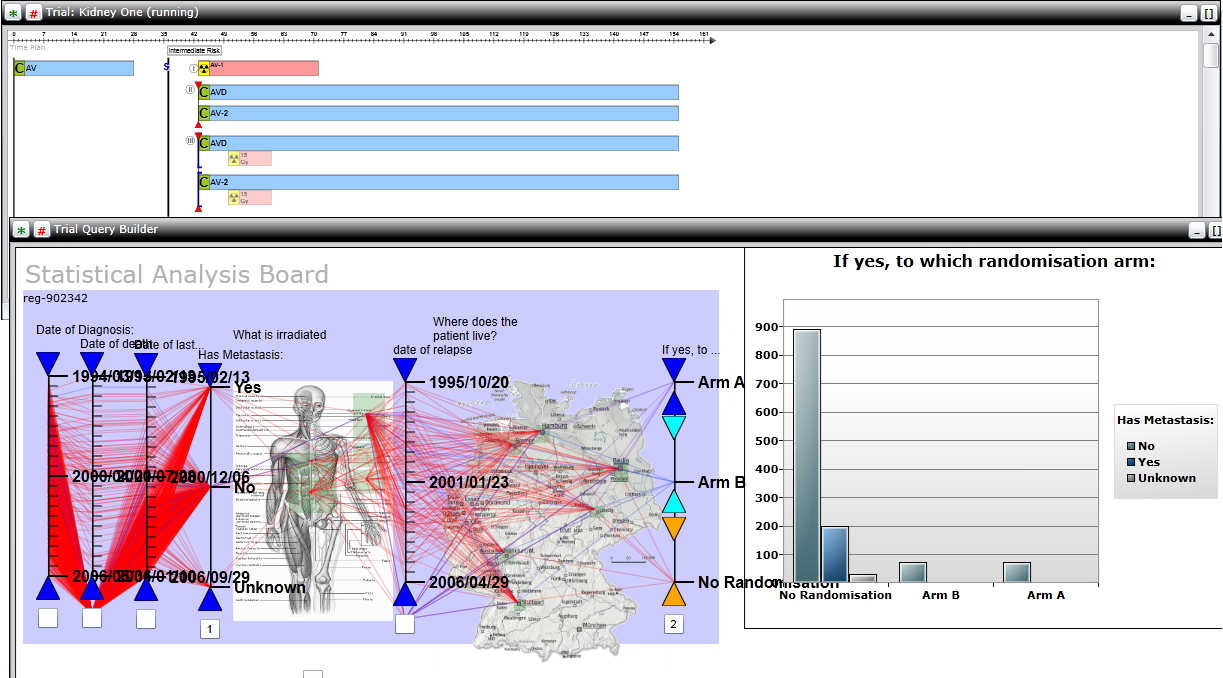
The TOB also allows for exploration
of the collected data. Many different visualization
components are available, such as charts, Life Tables,
parallel coordinates, image maps, heat maps, and
more. Subsets of patients based on different chriteria
can be selected, filtered, and grouped.
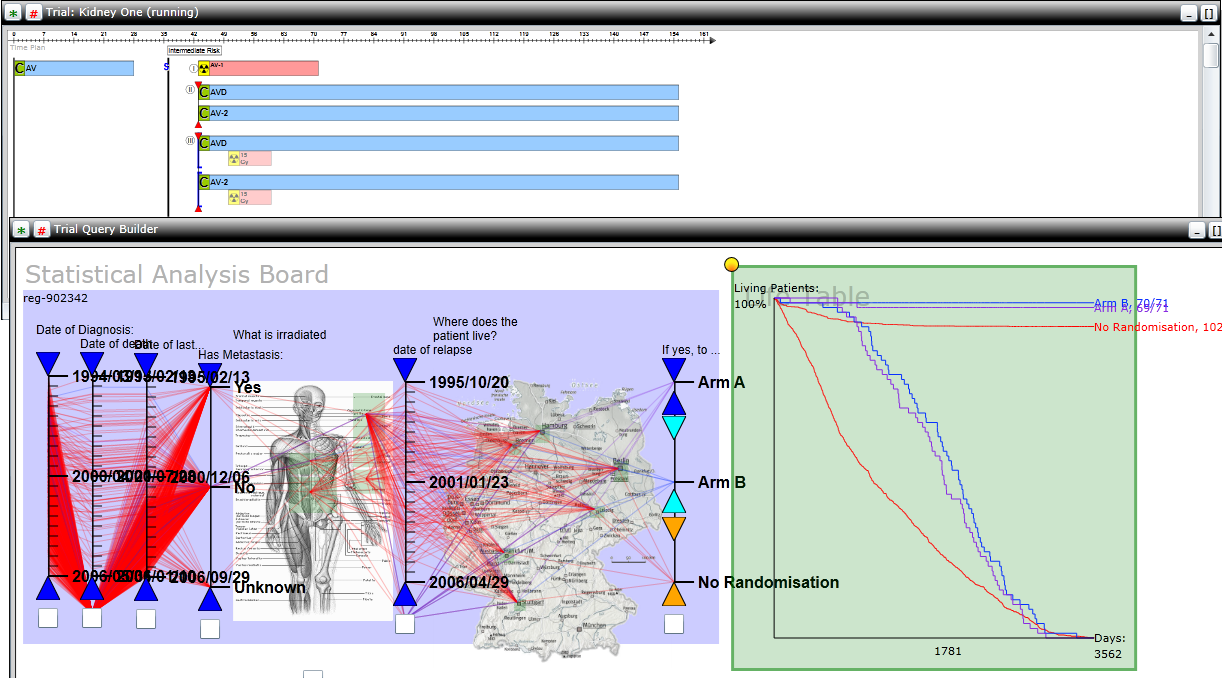
Here the user has grouped patients
based on the treatment received (randomization group
A, randomization group B, and no randomization) and
contrasted these groups against each other in a life
table on the right. There seems to be very little
difference between group A and B, but patients in the
no randomization group have a much lower
survivability. This was because patients with
metastatic cancer were all placed in the no
randomization group, and if the cancer has already
spread throughout the body the chance of survivability
is of course lower.
Movie
Here is a simple movie clip showing the basics of building a trial using the TOB: 22 Mb movie clip.